Statements builds monthly financial statements from your accounting data — and verifies every month against the source system’s own reports, so you never have to wonder whether the numbers are right.
Income Statement
Accounts as rows, months as columns, in your accounting system’s own structure: Income → Cost of Goods Sold → Gross Profit → Expenses → Net Operating Income → Other → Net Income. Use the Filter button to slice the whole statement by aClass or Location tag (the verification row hides while filtered, since it only applies to the full statement).
Balance Sheet
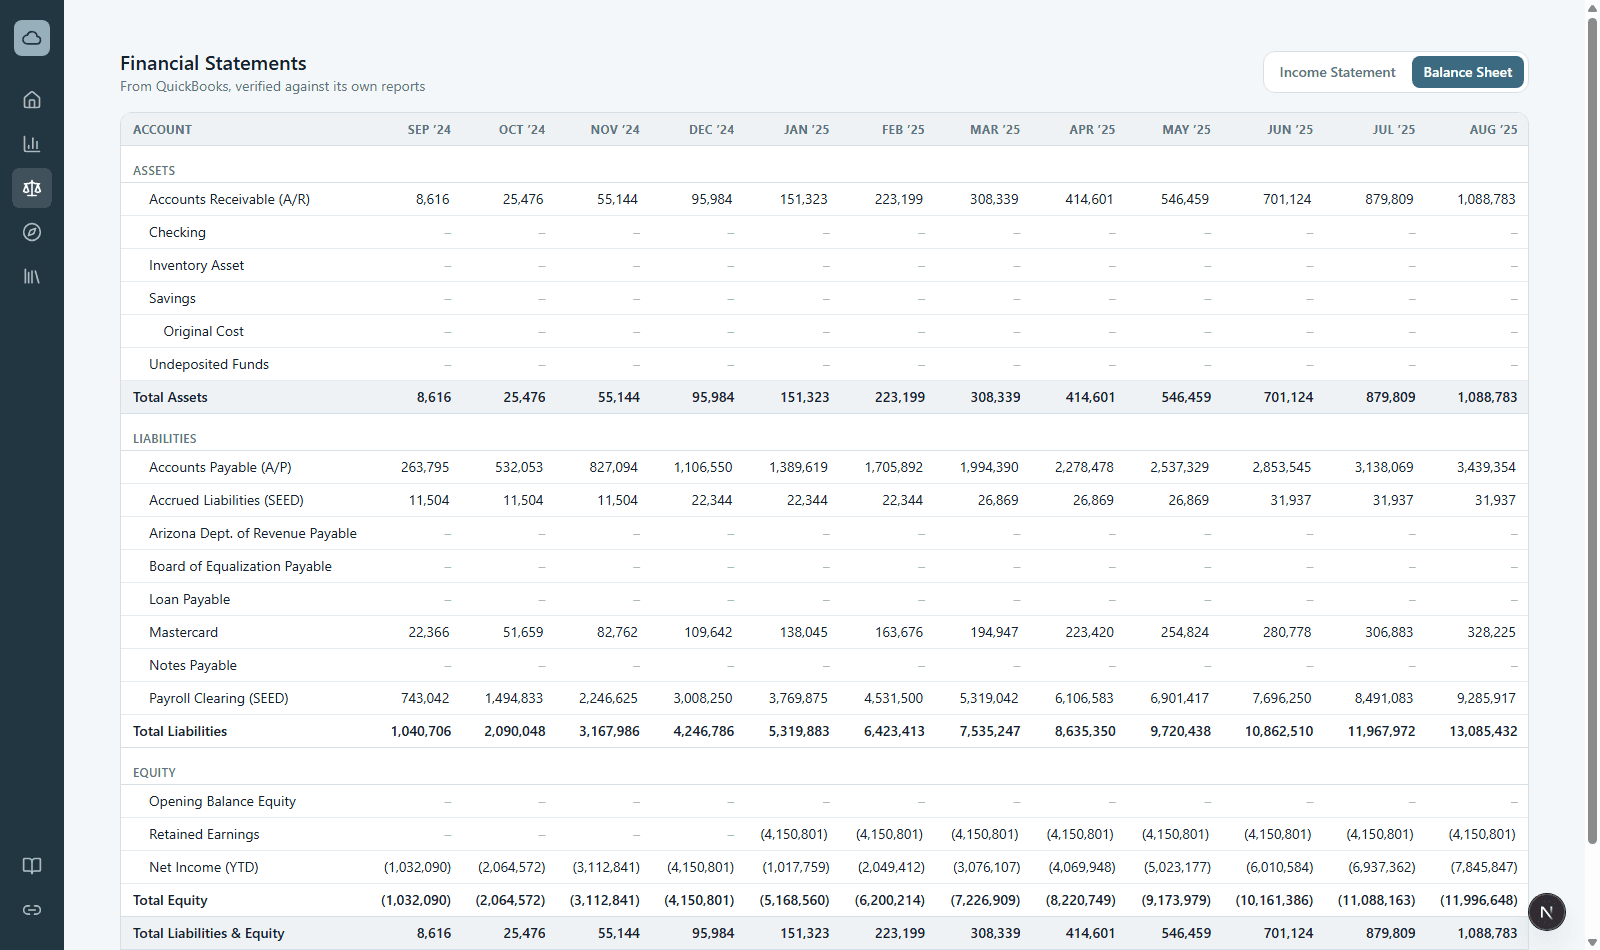
The Balance Sheet tab shows each account’s ending balance by month, grouped into Assets, Liabilities, and Equity. Under the hood every cell is a rollforward — beginning balance plus the month’s activity — so clicking a cell shows exactly that: a Beginning · Activity · Ending summary and the month’s transactions behind it.
Inside Equity you’ll see a Net Income (YTD) line — the current year’s profit or loss so far, computed from the P&L side. That mirrors how accounting systems present equity, and it’s what makes Total Assets equal Total Liabilities & Equity in every column.
“Ties to QuickBooks”
The last row of each statement compares Potenza’s totals against the totals QuickBooks itself reports for the same month — a green Ties check means an exact match, to the penny. If a month ever doesn’t tie, the difference is shown rather than hidden, so you can see the size of the discrepancy immediately.
Drilling into a number
Every account cell on both statements is clickable and opens the underlying transactions for that account and month — date, type, document number, counterparty, class, and amount.