The Balance Sheet sub-model forecasts your financial position month by month — cash, receivables, debt, equity. Unlike the P&L, where you plan every line, the balance sheet is mostly derived: you type only the few balances you have a view on, and Potenza works out the rest so the books always balance.
How the forecast is built
- Every line rolls forward. Each account starts at its last actual ending balance and holds flat into the future. Type a new ending balance in any month and it holds from there until you type another — so “A/R stays around $3.3M” is a single number, not one per month.
- Equity grows by your P&L plan’s profit. A locked Net income (cumulative) row carries your year-to-date earnings and adds the net income from your saved P&L forecast each month.
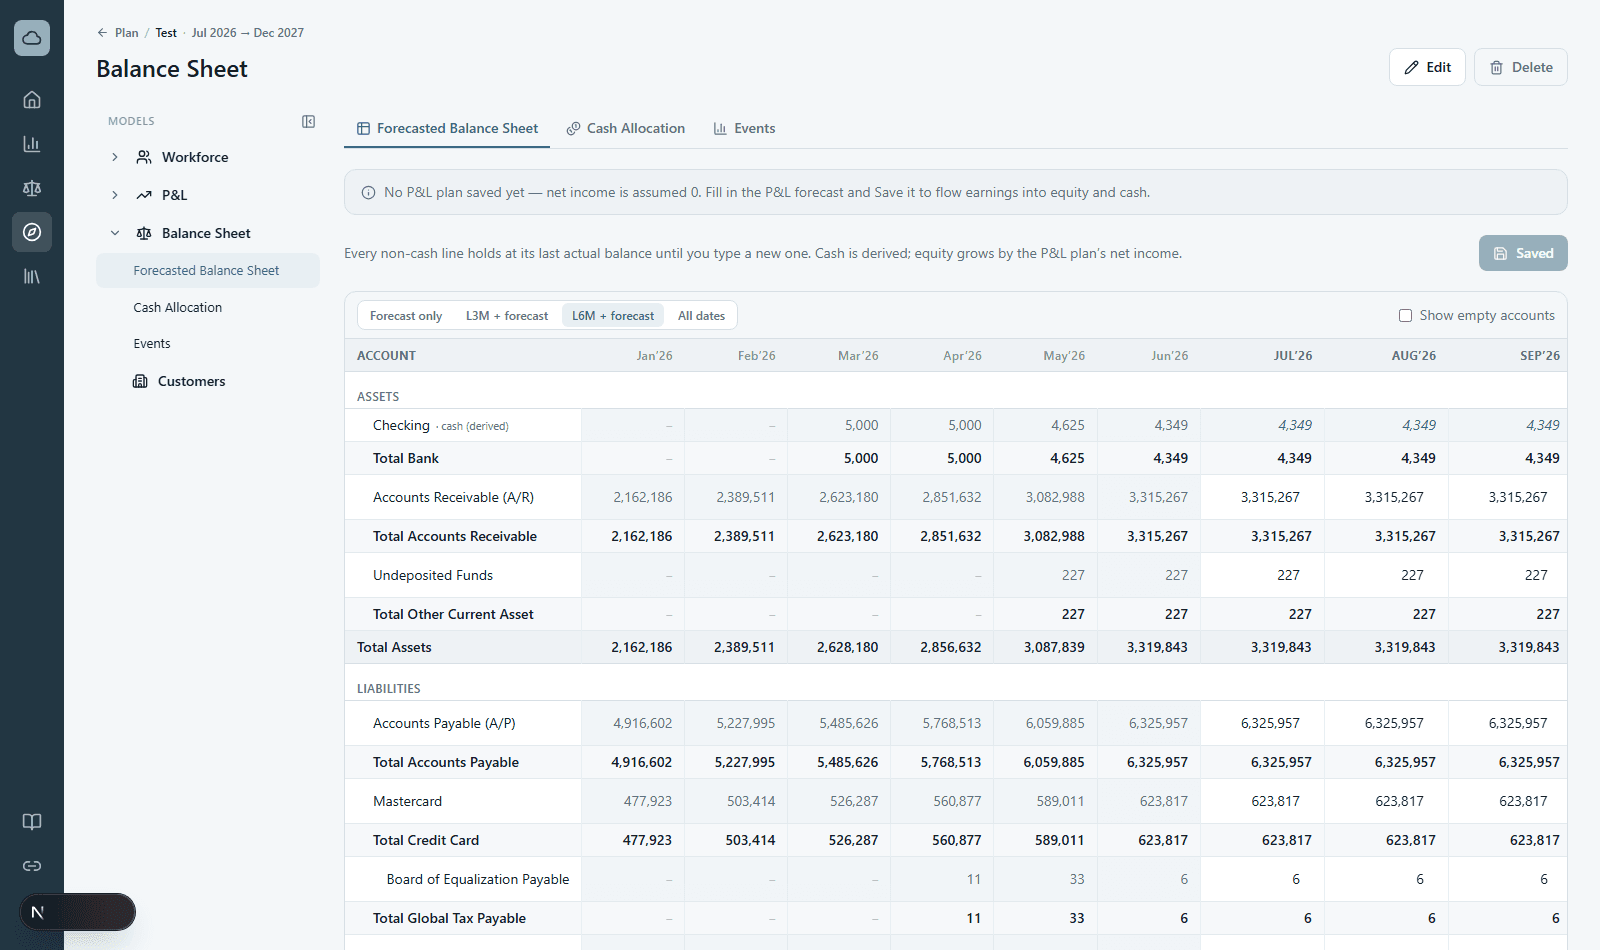
- Cash is the plug. Cash is never typed — it’s whatever number makes Assets equal Liabilities plus Equity every month. Your bank rows are computed and shown dimmed. If the plan runs the balance below zero, a banner tells you the first month it happens.
Events
An event is a one-line, dated change to a single account — a fundraise, a loan draw or paydown, a capital purchase. On the Events tab, pick a month and account, give it a label, and enter a positive amount to raise the balance or a negative one to lower it. The cash side is handled for you: raise $5M of equity and cash goes up $5M automatically, so the books stay balanced. Affected cells on the forecast get a small dot; hover to see the events behind them.
Cash Allocation
Because cash is derived as one total, the Cash Allocation tab decides which bank accounts hold it. Peg an account to a fixed balance, and pick one catch-all account to absorb the rest. Until you choose, your largest bank account is the catch-all. If your pegs add up to more cash than the plan has, the tab warns you rather than blocking it.
Reading the grid
- The dimmed columns on the left are your actual ending balances; the columns to the right are the forecast. Use the range buttons to show more or fewer actual months.
- Click a forecast cell on any non-cash line and type an ending balance. Typed cells show in bold; carried-forward cells are lighter. Press Enter or Tab to move on, or use the fill handle to hold flat, grow a percentage, or add a fixed amount across later months. Clear a cell to drop back to the carried value.
- Click Save to store your typed balances. The Cash flow bridge under the grid shows, month by month, how net income and the changes in each account add up to the change in cash.
Summary
The Summary tab is a visual read of the same forecast — a board of charts and metric cards for the balances you watch (cash, working capital, A/R, A/P, and more). Use Add metric to add a chart, drag to rearrange, set a global date range and monthly / quarterly / yearly grain, and Save to keep your layout. It reads your live forecast, so it moves as you edit the grid. Workforce and P&L have their own Summary boards too, each remembered separately per model.
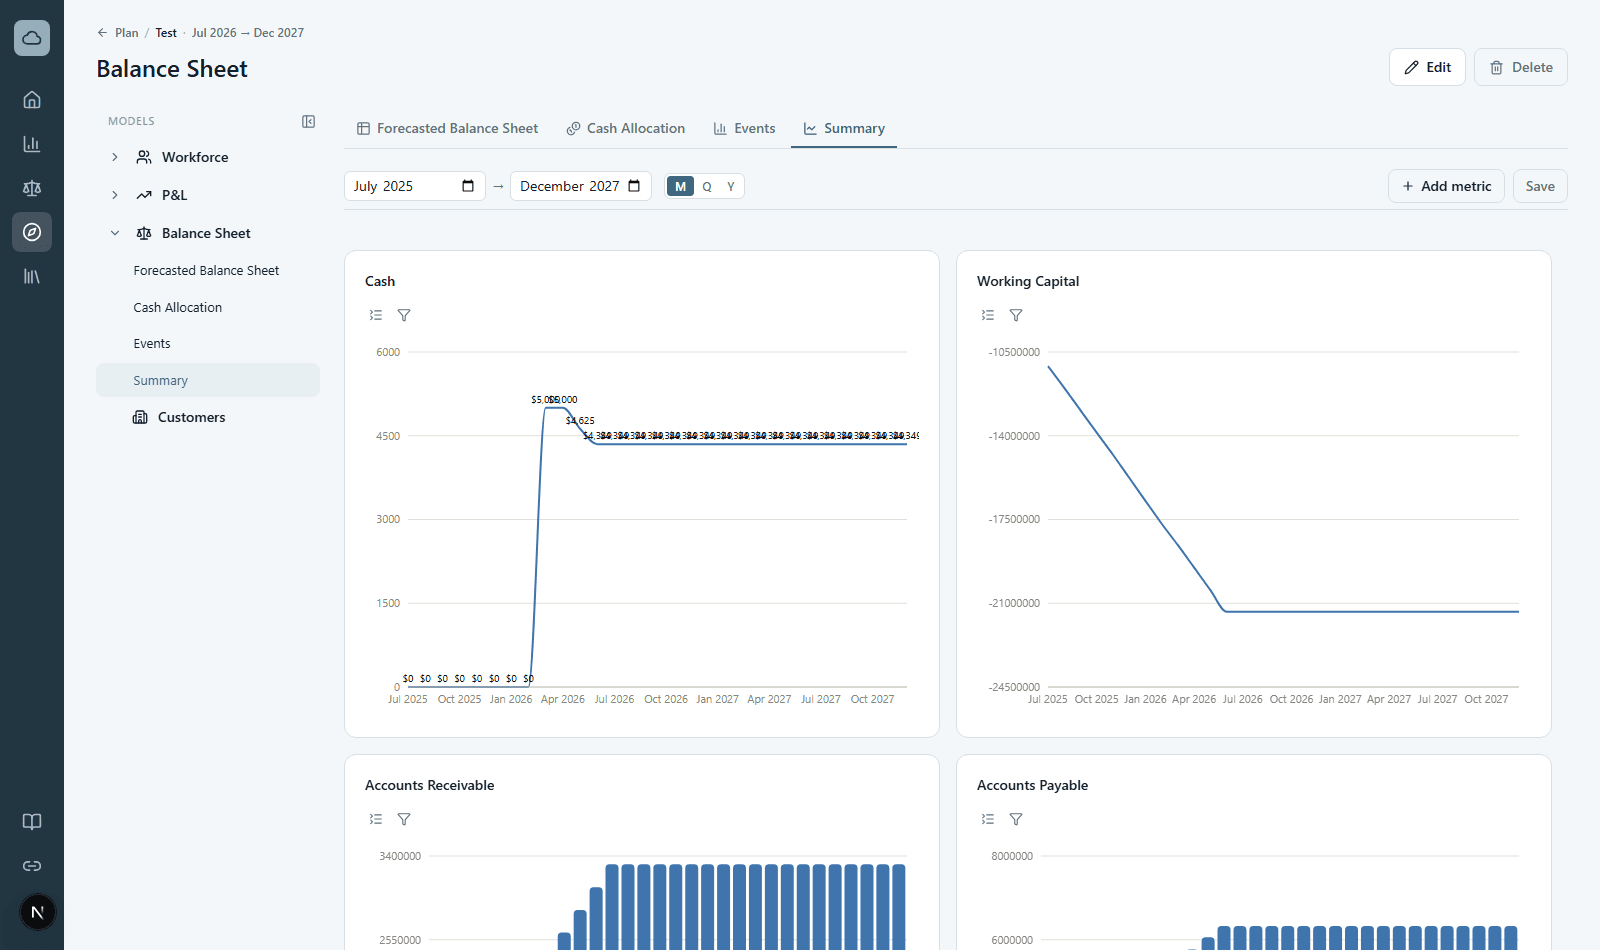
Net income only flows into equity and cash once you’ve saved a P&L plan for this model — until then a banner notes that net income is assumed 0. Everything here is saved per planning model, so each scenario keeps its own balances, events, and cash setup.