The Data Library is Potenza’s workspace for your data itself — what came in, how it was transformed, and what everything means. It has two kinds of tables.
Source tables
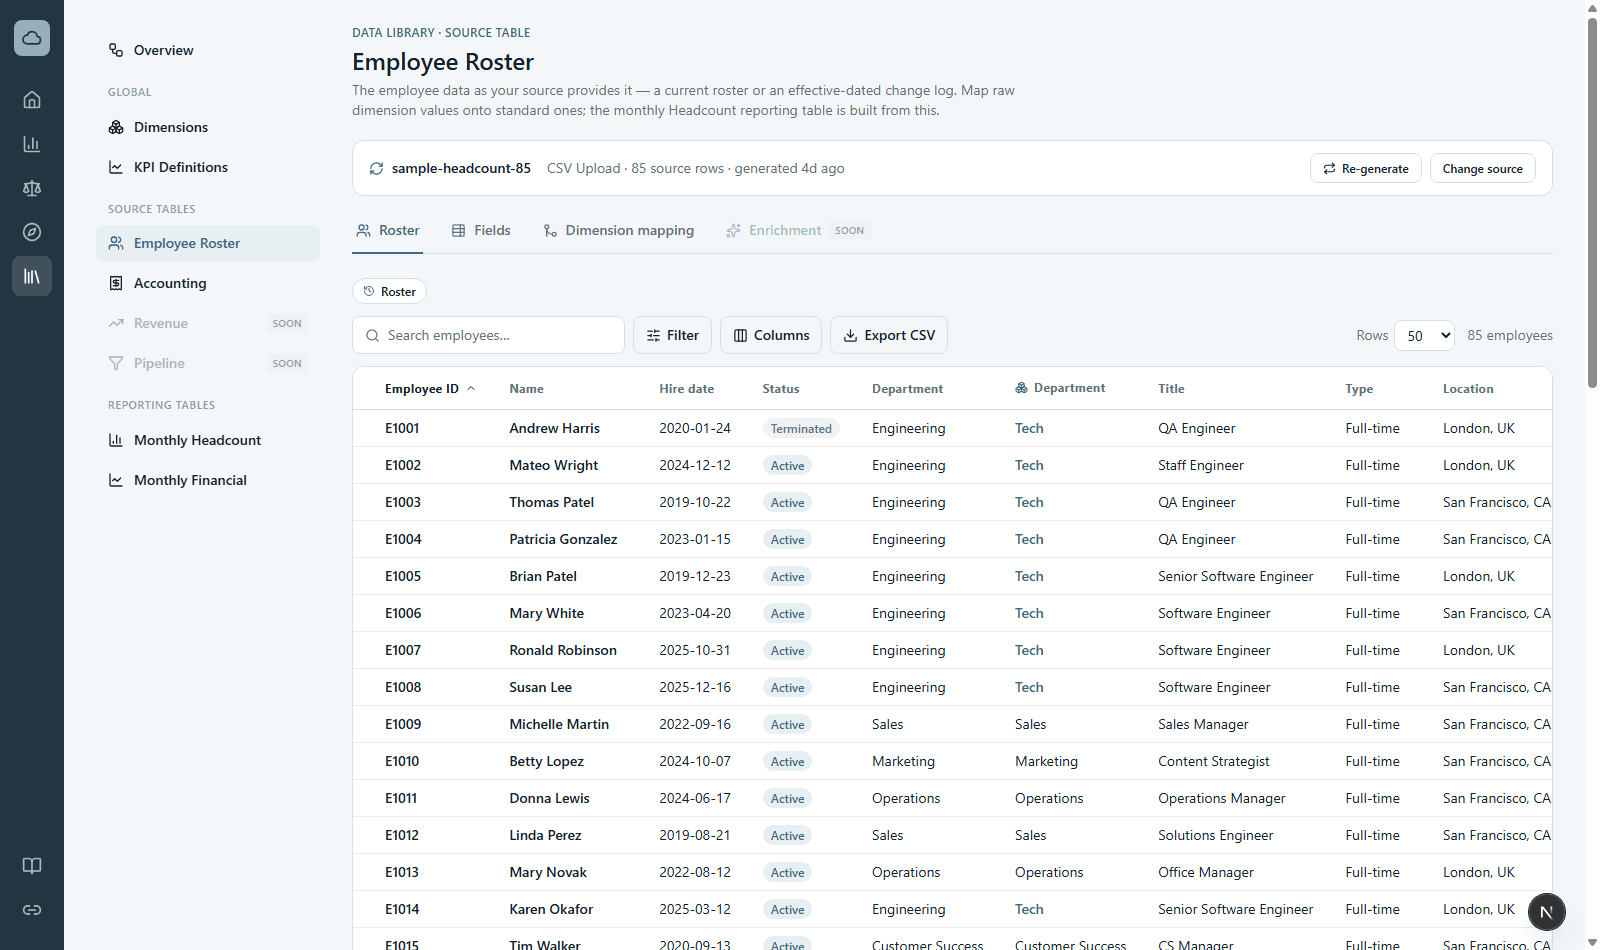
A source table holds your data at its natural grain, cleaned and standardized:
- Employee Roster — one row per employee. Employees with history (raises, transfers, terminations) expand to show their timeline. Works from either a simple roster export or an event log; Potenza detects the shape automatically.
- Accounting — one row per financial transaction line, covering both P&L activity and balance-sheet activity, with the account, class, location, and counterparty on every row.
An empty source table shows Create dataset: pick a connection and Potenza generates the table from it. Re-generating or refreshing the connection re-runs the same pipeline.
Reporting tables
Reporting tables are the monthly rollups Potenza materializes from source tables — Monthly Headcount (employee × month, with hire/termination flags) and Monthly Financial (account × month sums). Statements, metrics, and reports all read from these, and numbers in them link back to the rows they came from.
The Fields tab
Every table has a Fields tab — a data dictionary computed from your actual data. For each field it shows where it came from (your source file, a Potenza standard, a calculation, or a dimension), its type, and its lineage. Reporting-table fields show which source field they carry from.
The Overview
The Data Library’s landing page is a live map of your whole pipeline — connection → source table → monthly table → metrics → reports — with real counts at every stage and the last refresh time. It’s the quickest way to sanity-check that data flowed all the way through.